

Plotting With Perl 6
(This chapter originally appeared in Perl 6 Fundamentals: A Primer with Examples, Projects, and Case Studies, by Moritz Lenz, published 2017 by Apress Media, LLC. Reprinted with permission.)
Occasionally I come across git repositories where I want to know how active they are and who the main developers are.
Let’s develop a script that plots the commit history, and explore how to use Python modules in Perl 6.
Extracting the Stats
We want to plot the number of commits by author and date.
We can get this information easily by passing some options to git log:
my $proc = run :out, <git log --date=short --pretty=format:%ad!%an>;
my (%total, %by-author, %dates);
for $proc.out.lines -> $line {
    my ( $date, $author ) = $line.split: '!', 2;
    %total{$author}++;
    %by-author{$author}{$date}++;
    %dates{$date}++;
}
run executes an external command and :out tells it to capture the
command’s output, making it available as $proc.out. The command is
a list, with the first element being the actual executable and the rest of
the elements are command line arguments to this executable.
Here git log gets the options --date short --pretty=format:%ad!%an, which
instructs it to produce lines like 2017-03-01!John Doe. This line
can be parsed with a simple call to $line.split: '!', 2, which splits
on the ! and limits the result to two elements. Assigning it to a
two-element list ( $date, $author ) unpacks it. We then use hashes to
count commits by author (in %total), by author and date (%by-author),
and finally by date. In the second case, %by-author{$author} isn’t
even a hash yet and we can still hash-index it. This is due to a feature
called autovivification, which automatically creates (“vivifies”) objects
where we need them. The use of ++ creates integers, {...} indexing creates
hashes, [...] indexing, .push creates arrays, and so on.
To get from these hashes to the top contributors by commit count, we can
sort %total by value. Since this sorts in ascending order, sorting
by the negative value returns the list in descending order. The list contains
Pair objects, where we only want the
first five, and only their keys:
my @top-authors = %total.sort(-*.value).head(5).map(*.key);
For each author, we can extract the dates of their activity and their commit counts like this:
my @dates  = %by-author{$author}.keys.sort;
my @counts = %by-author{$author}{@dates};
The last line uses slicing, that is, indexing a hash with a list to return a list of elements.
Plotting with Python
Matplotlib is a very versatile library for all sorts of plotting and visualization tasks. It is based on NumPy, a Python library for scientific and numeric computing.
Matplotlib is written in Python and for Python programs, but that won’t stop us from using it in a Perl 6 program.
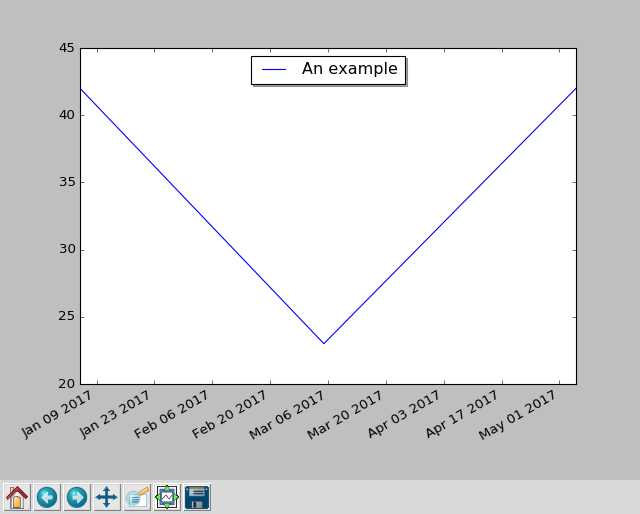
But first, let’s take a look at a basic plotting example that uses dates on the x-axis:
import datetime
import matplotlib.pyplot as plt

fig, subplots = plt.subplots()
subplots.plot(
    [datetime.date(2017, 1, 5), datetime.date(2017, 3, 5), datetime.date(2017, 5, 5)],
    [ 42, 23, 42 ],
    label='An example',
)
subplots.legend(loc='upper center', shadow=True)
fig.autofmt_xdate()
plt.show()
To make this run, you have to install Python 2.7 and matplotlib1. You can do
this on Debian-based Linux systems with apt-get install -y python-matplotlib.
The package name is the same on RPM-based distributions such as CentOS or SUSE
Linux. MacOS users are advised to install Python 2.7 through homebrew and
macports and then use pip2 install matplotlib or pip2.7 install matplotlib to get the library. Windows installation is probably easiest
through the conda package manager, which offers
pre-built binaries of both Python and matplotlib.
When you run this script with python2.7 dates.py, it opens a GUI window,
showing the plot and some controls, which allow you to zoom, scroll, and
write the plot graphic to a file:
Bridging the Gap
The Rakudo Perl 6 compiler comes with a handy library for calling foreign
functions – called NativeCall – which allows you to
call functions written in C, or anything with a compatible binary interface.
The Inline::Python library uses the native call functionality to talk to Python’s C API and offers interoperability between Perl 6 and Python code. At the time of writing, this interoperability is still fragile in places, but can be worth using for some of the great libraries that Python has to offer.
To install Inline::Python, you must have a C compiler available, and then
run
$ zef install Inline::Python
Now you can start to run Python 2 code in your Perl 6 programs:
use Inline::Python;

my $py = Inline::Python.new;
$py.run: 'print("Hello, Perl 6")';
Besides the run method, which takes a string of Python code and executes it,
you can also use call to call Python routines by specifying the namespace,
the routine to call, and a list of arguments:
use Inline::Python;

my $py = Inline::Python.new;
$py.run('import datetime');
my $date = $py.call('datetime', 'date', 2017, 1, 31);
$py.call('__builtin__', 'print', $date);    # 2017-01-31
The arguments that you pass to call are Perl 6 objects, such as the three Int
objects in this example. Inline::Python automatically translates them into
the corresponding Python built-in data structure. It translates numbers,
strings, arrays, and hashes. Return values are also translated in the opposite
direction, though since Python 2 does not distinguish properly between
byte and Unicode strings, Python strings end up as buffers in Perl 6.
Objects that Inline::Python cannot translate are handled as opaque objects
on the Perl 6 side. You can pass them back into Python routines (as shown
with the print call above) and you can call methods on them:
say $date.isoformat().decode; # 2017-01-31
Perl 6 exposes attributes through methods, so Perl 6 has no syntax for
accessing attributes from foreign objects directly. For instance, if you try to access
the year attribute of datetime.date through the normal method
call syntax, you get an error:
say $date.year;
dies with
'int' object is not callable
Instead, you have to use the getattr builtin:
say $py.call('__builtin__', 'getattr', $date, 'year');
Using the Bridge to Plot
We need access to two namespaces in Python, datetime and matplotlib.pyplot,
so let’s start by importing them and writing some short helpers:
my $py = Inline::Python.new;
$py.run('import datetime');
$py.run('import matplotlib.pyplot');
sub plot(Str $name, |c) {
    $py.call('matplotlib.pyplot', $name, |c);
}

sub pydate(Str $d) {
    $py.call('datetime', 'date', $d.split('-').map(*.Int));
}
We can now call pydate('2017-03-01') to create a Python datetime.date
object from an ISO-formatted string and call the plot function to access
functionality from matplotlib:
my ($figure, $subplots) = plot('subplots');
$figure.autofmt_xdate();

my @dates = %dates.keys.sort;
$subplots.plot:
    $[@dates.map(&pydate)],
    $[ %dates{@dates} ],
    label     => 'Total',
    marker    => '.',
    linestyle => '';
The Perl 6 call plot('subplots') corresponds to the Python code
fig, subplots = plt.subplots(). Passing arrays to Python functions needs
a bit of extra work, because Inline::Python flattens arrays. Using an extra $
sigil in front of an array puts it into an extra scalar and thus prevents
the flattening.
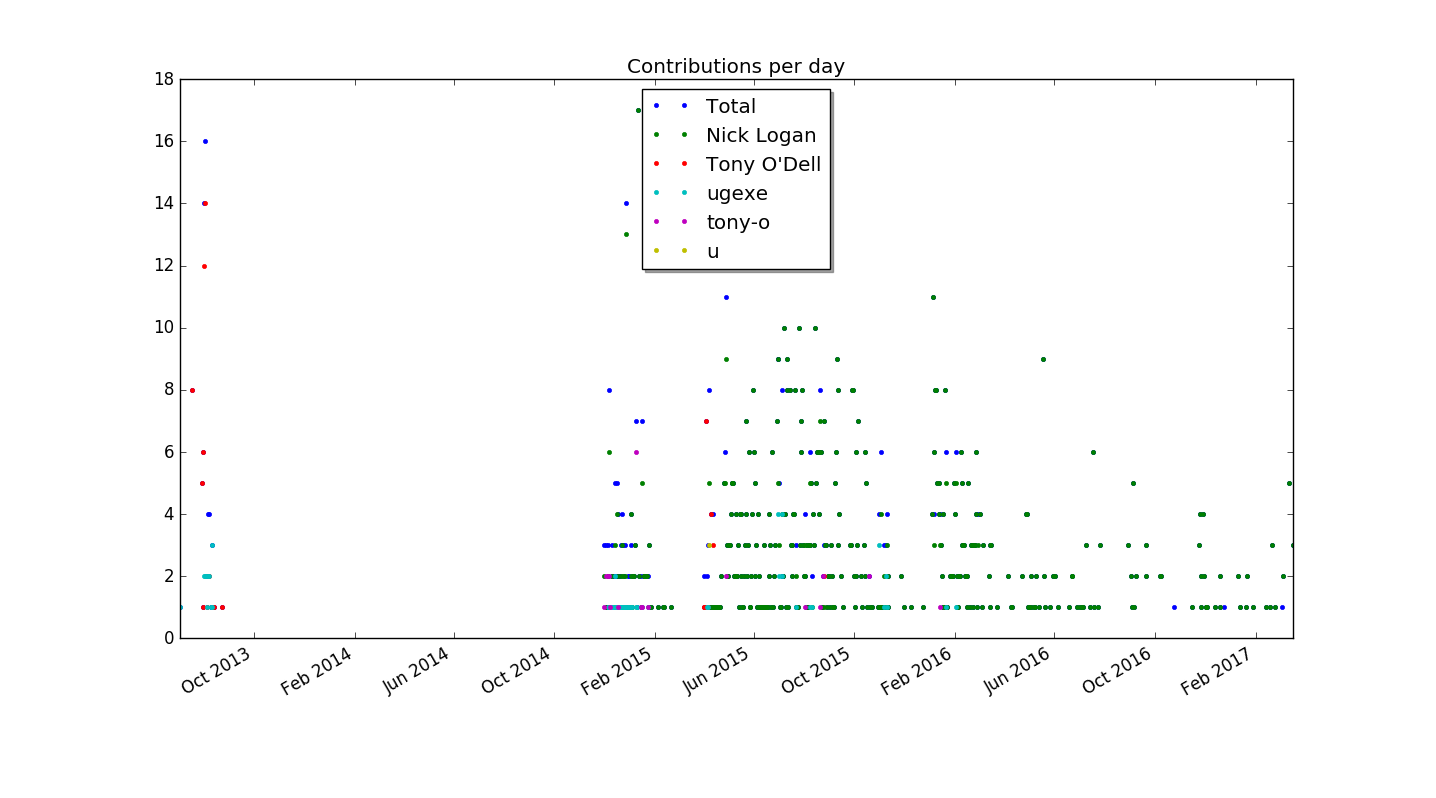
Now we can actually plot the number of commits by author, add a legend, and plot the result:
for @top-authors -> $author {
    my @dates = %by-author{$author}.keys.sort;
    my @counts = %by-author{$author}{@dates};
    $subplots.plot:
        $[ @dates.map(&pydate) ],
        $@counts,
        label     => $author,
        marker    =>'.',
        linestyle => '';
}


$subplots.legend(loc=>'upper center', shadow=>True);

plot('title', 'Contributions per day');
plot('show');
When run in the zef git repository, it produces this plot:
Stacked Plots
I am not yet happy with the plot, so I want to explore using stacked plots for presenting the same information. In a regular plot, the y-coordinate of each plotted value is proportional to its value. In a stacked plot, it is the distance to the previous value that is proportional to its value. This is nice for values that add up to a total that is also interesting.
Matplotlib offers a method called
stackplot
for this task. Contrary to multiple plot calls on a subplot object, it
requires a shared x-axis for all data series. Hence we must construct
one array for each author of git commits, where dates with no value are
set to zero.
This time we have to construct an array of arrays where each inner array has the values for one author:
my @dates = %dates.keys.sort;
my @stack = $[] xx @top-authors;

for @dates -> $d {
    for @top-authors.kv -> $idx, $author {
        @stack[$idx].push: %by-author{$author}{$d} // 0;
    }
}
Now plotting becomes a simple matter of a method call, followed by the usual commands to add a title and show the plot:
$subplots.stackplot($[@dates.map(&pydate)], @stack);
plot('title', 'Contributions per day');
plot('show');
The result (again run on the zef source repository) is this:
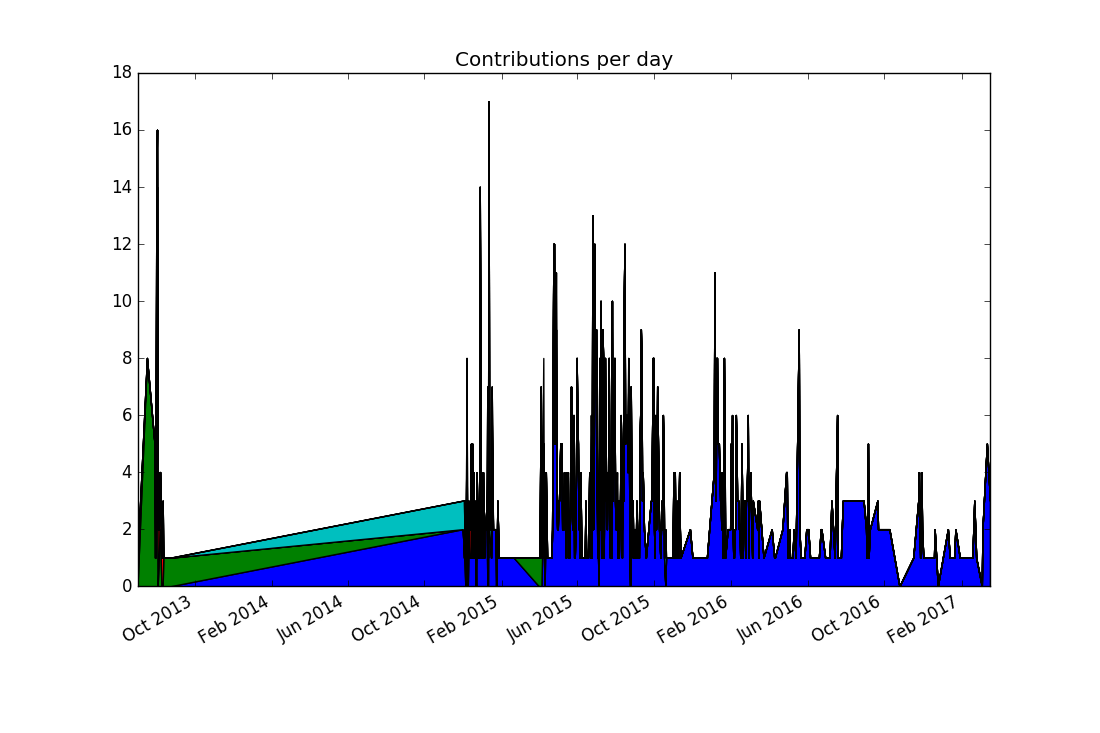
Comparing this to the previous visualization reveals a discrepancy: There were no commits in 2014, and yet the stacked plot makes it appear this way. In fact, the previous plots would have shown the same “alternative facts” if we had chosen lines instead of points. It comes from matplotlib (like nearly all plotting libraries) interpolates linearly between data points. But in our case, a date with no data points means zero commits happened on that date.
To communicate this to matplotlib, we must explicitly insert zero values for missing dates. This can be achieved by replacing
my @dates = %dates.keys.sort;
with the line
my @dates = %dates.keys.minmax;
The minmax method
finds the minimal and maximal values, and returns them in a
Range. Assigning the range to an
array turns it into an array of all values between the minimal and the
maximal value. The logic for assembling the @stack variable already
maps missing values to zero.
The result looks a bit better, but still far from perfect:
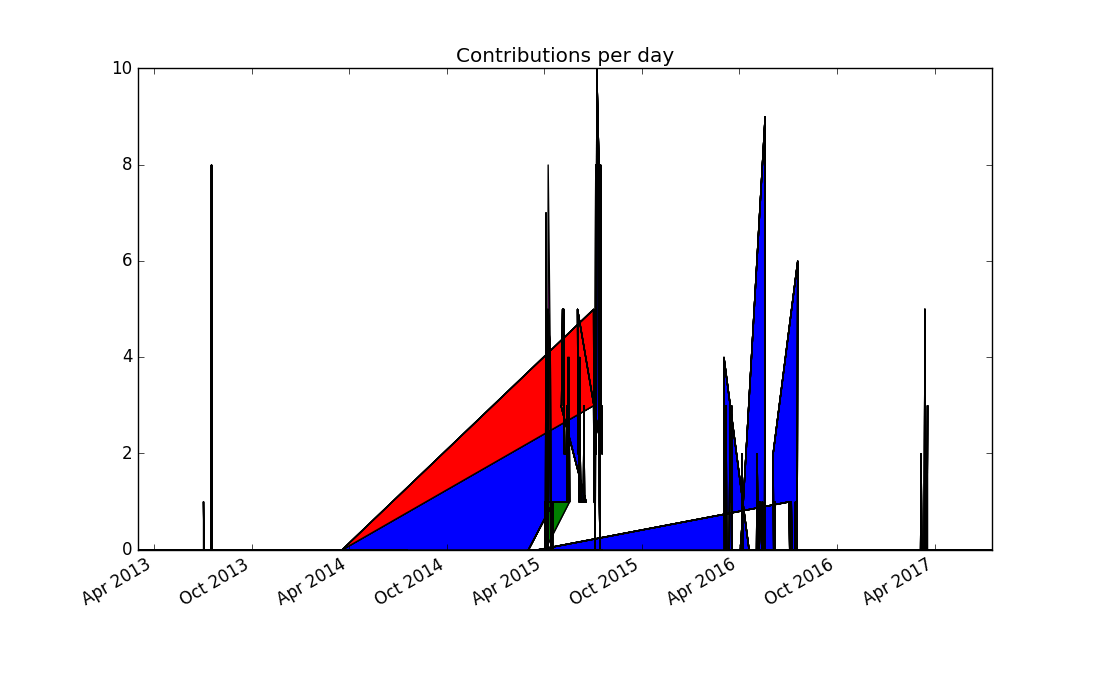
Thinking more about the problem, contributions from separate days should not be joined together, because it produces misleading results. Matplotlib doesn’t support adding a legend automatically to stacked plots, so this seems to be to be a dead end.
Since a dot plot didn’t work very well, let’s try a different kind of
plot that represents each data point separately: a bar chart, or more
specifically, a stacked bar chart. Matplotlib offers the bar plotting
method where the named parameter bottom can be used to generate the
stacking:
my @dates = %dates.keys.sort;
my @stack = $[] xx @top-authors;
my @bottom = $[] xx @top-authors;

for @dates -> $d {
    my $bottom = 0;
    for @top-authors.kv -> $idx, $author {
        @bottom[$idx].push: $bottom;
        my $value = %by-author{$author}{$d} // 0;
        @stack[$idx].push: $value;
        $bottom += $value;
    }
}
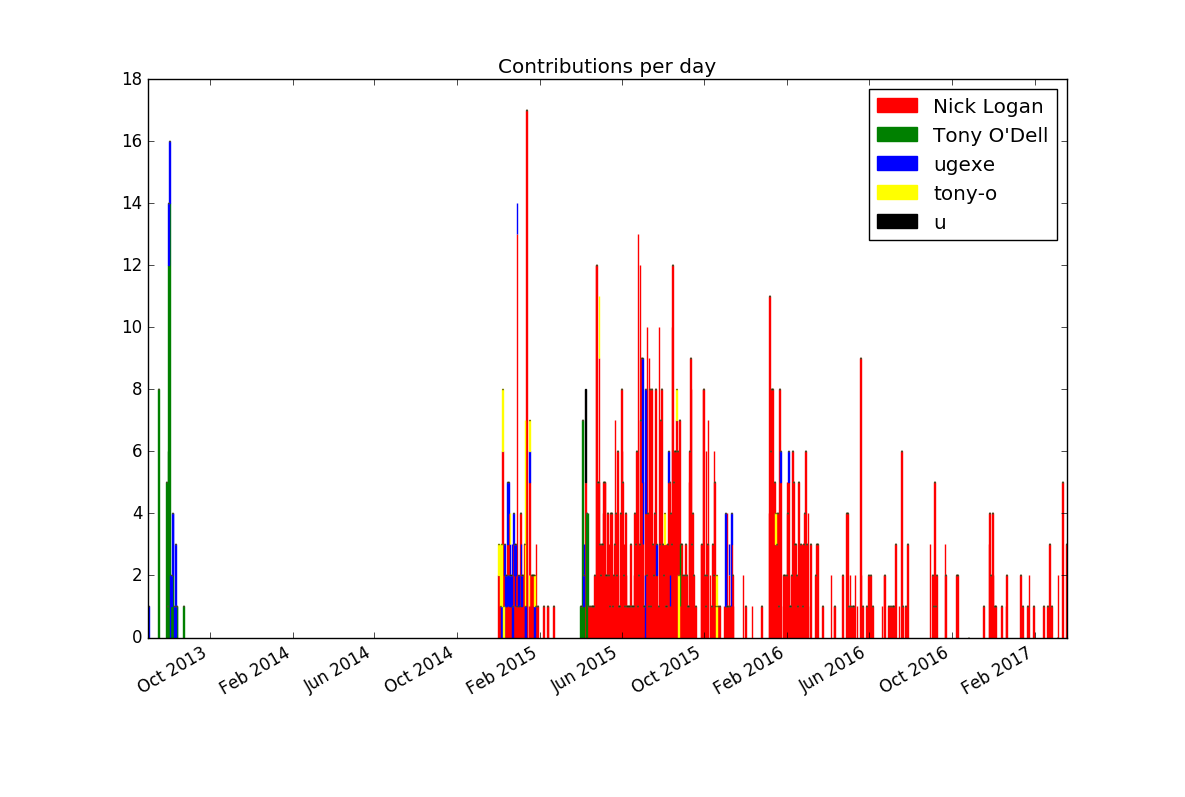
We need to supply color names ourselves and set the edge color of the bars to the same color, otherwise the black edge color dominates the result:
my $width = 1.0;
my @colors = <red green blue yellow black>;
my @plots;

for @top-authors.kv -> $idx, $author {
    @plots.push: plot(
        'bar',
        $[@dates.map(&pydate)],
        @stack[$idx],
        $width,
        bottom => @bottom[$idx],
        color => @colors[$idx],
        edgecolor => @colors[$idx],
    );
}
plot('legend', $@plots, $@top-authors);

plot('title', 'Contributions per day');
plot('show');
This produces the first plot that’s actually informative and not misleading (provided you’re not color blind):
If you want to improve the result further, you could experiment with
limiting the number of bars by lumping together contributions by week or
month (or maybe $n-day period).
Idiomatic Use of Inline::Python
Now that the plots look informative and correct, it’s time to explore how
to better emulate the typical Python APIs through Inline::Python.
Types of Python APIs
Python is an object-oriented language, so many APIs involve method
calls, which Inline::Python helpfully automatically translates for us.
But the objects must come from somewhere and typically this is by calling a function that returns an object, or by instantiating a class. In Python, those two are really the same under the hood, since instantiating a class is the same as calling the class as if it were a function.
An example of this (in Python) would be
from matplotlib.pyplot import subplots
result = subplots()
But the matplotlib documentation tends to use another, equivalent syntax:
import matplotlib.pyplot as plt
result = plt.subplots()
This uses the subplots symbol (class or function) as a method on the
module matplotlib.pyplot, which the import statement aliases to plt.
This is a more object-oriented syntax for the same API.
Mapping the Function API
The previous code examples used this Perl 6 code to call the subplots
symbol:
my $py = Inline::Python.new;
$py.run('import matplotlib.pyplot');
sub plot(Str $name, |c) {
    $py.call('matplotlib.pyplot', $name, |c);
}

my ($figure, $subplots) = plot('subplots');
If we want to call subplots() instead of plot('subplots'), and
bar(args) instead of plot('bar', args), we can use a function to
generate wrapper functions:
my $py = Inline::Python.new;

sub gen(Str $namespace, *@names) {
    $py.run("import $namespace");

    return @names.map: -> $name {
        sub (|args) {
            $py.call($namespace, $name, |args);
        }
    }
}

my (&subplots, &bar, &legend, &title, &show)
    = gen('matplotlib.pyplot', <subplots bar legend title show>);

my ($figure, $subplots) = subplots();

# more code here

legend($@plots, $@top-authors);
title('Contributions per day');
show();
This makes the functions’ usage quite nice, but comes at the cost of duplicating their names. One can view this as a feature, because it allows the creation of different aliases, or as a source for bugs when the order is messed up, or a name misspelled.
How could we avoid the duplication should we choose to create wrapper functions?
This is where Perl 6’s flexibility and introspection abilities pay off. There are two key components that allow a nicer solution: the fact that declarations are expressions, and that you can introspect variables for their names.
The first part means you can write mysub my ($a, $b), which
declares the variables $a and $b, and calls a function with those
variables as arguments. The second part means that $a.VAR.name returns
a string '$a', the name of the variable.
Let’s combine this to create a wrapper that initializes subroutines for us:
sub pysub(Str $namespace, |args) {
    $py.run("import $namespace");

    for args[0] <-> $sub {
        my $name = $sub.VAR.name.substr(1);
        $sub = sub (|args) {
            $py.call($namespace, $name, |args);
        }
    }
}

pysub 'matplotlib.pyplot',
    my (&subplots, &bar, &legend, &title, &show);
This avoids duplicating the name, but forces us to use some lower-level
Perl 6 features in sub pysub. Using ordinary variables means that accessing their
.VAR.name results in the name of the variable, not the name of the
variable that’s used on the caller side. So we can’t use slurpy
arguments as in
sub pysub(Str $namespace, *@subs)
Instead we must use
|args to obtain the rest of the arguments in a
Capture. This doesn’t
flatten the list of variables passed to the function, so when we iterate
over them, we must do so by accessing args[0]. By default, loop
variables are read-only, which we can avoid by using <-> instead of
-> to introduce the signature. Fortunately, that also preserves the
name of the caller side variable.
An Object-Oriented Interface
Instead of exposing the functions, we can also create types that emulate
the method calls on Python modules. For that we can implement a class with a
method FALLBACK, which Perl 6 calls for us when calling a method that is not
implemented in the class:
class PyPlot is Mu {
    has $.py;
    submethod TWEAK {
        $!py.run('import matplotlib.pyplot');
    }
    method FALLBACK($name, |args) {
        $!py.call('matplotlib.pyplot', $name, |args);
    }
}

my $pyplot = PyPlot.new(:$py);
my ($figure, $subplots) = $pyplot.subplots;
# plotting code goes here
$pyplot.legend($@plots, $@top-authors);

$pyplot.title('Contributions per day');
$pyplot.show;
Class PyPlot inherits directly from Mu, the root of the Perl 6 type
hierarchy, instead of Any, the default parent class (which in turn inherits
from Mu). Any introduces a large number of methods that Perl 6 objects
get by default and since FALLBACK is only invoked when a method is not
present, this is something to avoid.
The method TWEAK is another method that
Perl 6 calls automatically for us, after the object has been fully
instantiated. All-caps method names are reserved for such special purposes.
It is marked as a submethod, which means it is not inherited into subclasses.
Since TWEAK is called at the level of each class, if it were a regular
method, a subclass would call it twice implicitly. Note that TWEAK is only
supported in Rakudo version 2016.11 and later.
There’s nothing specific to the Python package matplotlib.pyplot in class
PyPlot, except the namespace name. We could easily generalize it to any
namespace:
class PythonModule is Mu {
    has $.py;
    has $.namespace;
    submethod TWEAK {
        $!py.run("import $!namespace");
    }
    method FALLBACK($name, |args) {
        $!py.call($!namespace, $name, |args);
    }
}

my $pyplot = PythonModule.new(:$py, :namespace<matplotlib.pyplot>);
This is one Perl 6 type that can represent any Python module. If instead we want a separate Perl 6 type for each Python module, we could use roles, which are optionally parameterized:
role PythonModule[Str $namespace] is Mu {
    has $.py;
    submethod TWEAK {
        $!py.run("import $namespace");
    }
    method FALLBACK($name, |args) {
        $!py.call($namespace, $name, |args);
    }
}

my $pyplot = PythonModule['matplotlib.pyplot'].new(:$py);
Using this approach, we can create type constraints for Python modules in Perl 6 space:
sub plot-histogram(PythonModule['matplotlib.pyplot'], @data) {
    # implementation here
}
Passing in any wrapped Python module other than matplotlib.pyplot results
in a type error.
Summary
We’ve explored several ways to represent commit occurrence in plots and
utilized Inline::Python to interface with a Python based plotting library.
A bit of Perl 6 meta programming allowed us to emulate different kinds of Python APIs pretty directly in Perl 6 code, allowing a fairly direct translation of the original library’s documentation into Perl 6 code.
1: The reason why Python 2.7 has to be used is that, at the time of writing, `Inline::Python` does not yet support Python 3.
This article was originally posted on PerlTricks.com.
Tags
Moritz Lenz
Moritz Lenz is a software developer, architect, problem solver and author. He is a core contributor to the Perl 6 project, and has been dabbling with the language for ten years.
Browse their articles
Feedback
Something wrong with this article? Help us out by opening an issue or pull request on GitHub
Site Map
License
This work is licensed under a Creative Commons Attribution-NonCommercial 3.0 Unported License.

Legal
Perl.com and the authors make no representations with respect to the accuracy or completeness of the contents of all work on this website and specifically disclaim all warranties, including without limitation warranties of fitness for a particular purpose. The information published on this website may not be suitable for every situation. All work on this website is provided with the understanding that Perl.com and the authors are not engaged in rendering professional services. Neither Perl.com nor the authors shall be liable for damages arising herefrom.